The people and pay
National trade wages, education and apprenticeship pathways. Not a count of data center workers.
Meet the trades →Main Street Megawatt · America's AI buildout
Electricians, pipefitters, ironworkers, linemen and other skilled trades are building the infrastructure behind AI. Follow the jobs, the local costs and the officials where you live.
Find jobs and officials near me Explore the national map
Cancelled projects are excluded. $422 billion is announced, not spent. The 1.09 points come from broader IT investment. Methods and confidence labels · BEA source
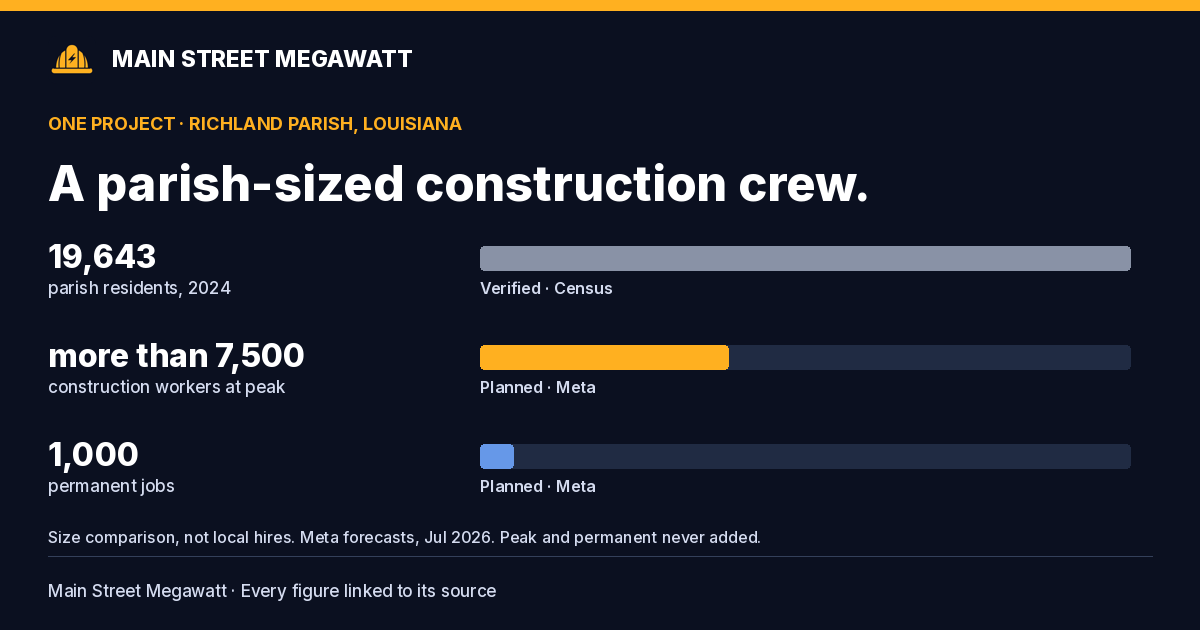
In Richland Parish, a planned construction crew would stand beside the parish population. A much smaller permanent staff is what Meta says would remain after the build.
One project · Richland Parish, Louisiana
Sources: Census Bureau, July 2024 population estimate.1 Meta, July 2026 workforce forecast.2 Many workers travel in. This is a scale comparison, not a local-hire count. Peak construction and permanent jobs are never added together. The construction bar uses 7,500 as a lower bound.
Each state shaded by the measure you pick. Darker means more. Tap, hover or tab to a state for its figure. Press Enter or click to open the state page. The table below the key has the same data. Only sourced figures are counted.
Each state shows the largest sourced peak construction crew forecast for ONE project, not total state jobs. Projects peak in different years. Do not add figures across states or years.
Embed this map on your site.
National trade wages, education and apprenticeship pathways. Not a count of data center workers.
Meet the trades →Employer careers pages, union halls and apprenticeship resources. We link out rather than host job listings.
Find job pathways →Construction spending, announced investment and broader IT’s contribution to growth, kept distinct.
See the economic picture →Power bills, water, housing and taxes. See the documented figures, the gaps in our sources and the questions residents can ask.
Who pays the local costs? →Moratoriums and restrictions, with executive actions separated from proposals and local decisions.
Open the tracker →Explore sites tracked per state · Search every tracked site · Officials and their own words
Every figure links to evidence. Read the methods · Browse sources
Pick your state to see your governor, senators and House members, the data center sites they represent and how to reach them. Party shown as a letter. Rosters from the House Clerk3, the Senate4 and the National Governors Association5. Districts from the Census geocoder at each site point6.
Record types: Quote their own words · Paraphrase a summary by a named outlet · Vote recorded a recorded vote.